UNDERSTANDING PROMETHEUS FOR BEGINNERS (like me)
Decided to write an article while learning
1. DEFINITION
- Prometheus is mainly a monitoring tool for highly complex container infrastructures like Kubernetes and Swarm (in docker), though it can also be used to monitor non containerized applications.
2. USE
Imagine we have a Kubernetes cluster having 100 nodes running multiple services and application in it and everything according to you is running absolutely fine but suddenly your cluster showed error, now you are confused because you did not knew that their was any problem and also you now also you don't know where is the problem, you have to find out manually to find the cause of error, which will be very time consuming (here Prometheus becomes very useful).
Prometheus constantly monitors all the services and resources running inside the cluster, alerts when something crashes (also tells where is the issue) or even better, it also can alert the maintainer of the infrastructure before any problem occurs. For example if you want to stop any error regarding memory overload, you can use Prometheus, like it monitors all nodes every allocated time and when the memory usage exceeds 70% (let say) it notifies the maintainer about it. Like this a future error is avoided.
3. ARCHITECTURE
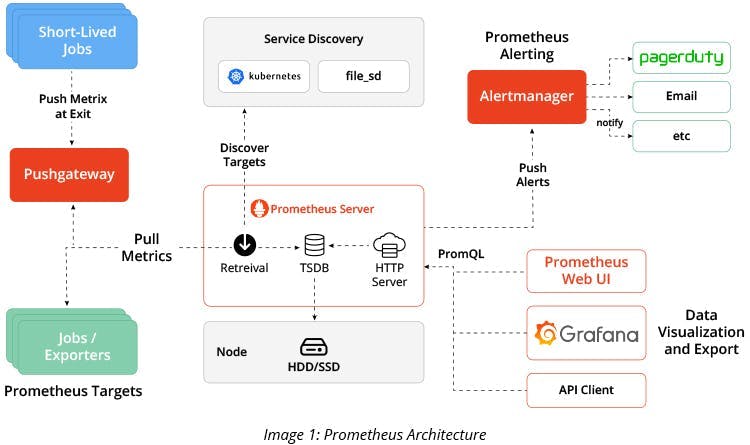
Prometheus can monitor many things, like an application, services in the cluster, frontend component of web etc. So what Prometheus monitors is called targets. Units which are monitored for different targets are different, like for an application it will be no. of requests, for a windows server it will be CPU status, for a database it will space usage etc. So these different units which Premotheus monitors are called metrics, it is basically data which tells about the infrastructure state.
Prometheus formats this metrics (data) in human-readable text, it consists Help (description of the metrics) and Type (type of metrics - 1. Counter - how many time x happened, 2. Gauge - what is the current value of x now, 3. Histogram - size of x)
for configuring prometheus yaml file is used, in this you can tell it what, when or at what time interval to pull and many more things

MAIN COMPONENT - PROMETHEUS SERVER
1st PART - RETRIEVAL
Retrieval pulls metrics from the targets from an HTTP endpoint which by default is hostaddress/metrics. For this two requirements must be followed
- Work target should expose metrics endpoint
- The data available at that endpoint must be in a format which Prometheus understands.
To complete these requirements an additional component is required inside the targets called exporter. Exporter is a service which fetches metrics from the target and converts it into required format, then it exposes the metrices at its own /metrics endpoint from where Prometheus can pull them.
2nd PART - STORAGE
- Retrieval sends all this data to the storage component. It stores all this metrics on data local disk (HDD/SSD) and it is also integrated with remote storage systems. It is stored in custom time series format.
3rd PART - SERVER API
- HTTP API accepts the queries from the storage. Now we can visualize this data via Prometheus Web UI or we can also use Grafana (data visualization tool) to display the metrics. Both these use PromQL to fetch the data from Server API.
ADVANTAGE OF PROMETHEUS OVER OTHER MONITORING TOOLS
- Other monitoring tools like ACW push their data to a centralized collection platform, which creates lots of problem like storage etc. Also for AWS, targets must have AWS daemon to work but that is not the case with Prometheus, it just needs targets to be exposed to /metrics endpoint.